import numpy as np
import matplotlib.pyplot as plt
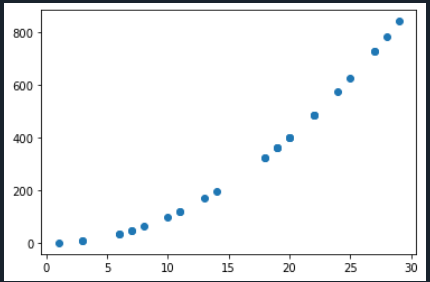
#Generate ramdom intergers beetween 1 to 32
x = np.random.randint(1, 32, size=30)
# Sqaures on integers in x
y = np.square(x)
#Create scatter plot
plt.scatter(x, y)
plt.show()
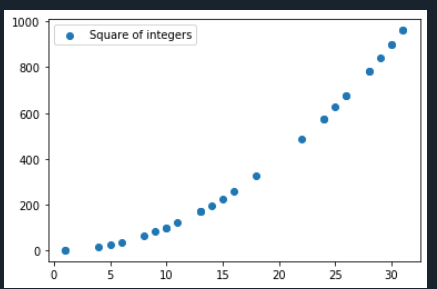
Python | Scatter plot with matplotlib
Matplotlib is a Python 2D plotting library which produces quality figures in a variety of formats
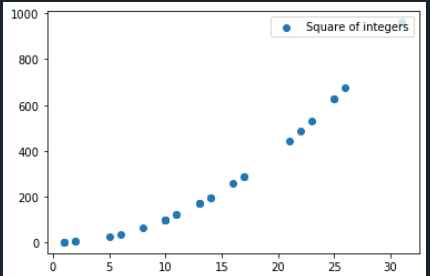
Refer below code for creating scatter plots with matplotlib. pyplot, showing legend and changing position of the legend.
Follow US on Twitter: Follow @gcptutorials
Similar Articles
Latest Articles


Popular Articles

